Seechi Disk Readings
Water clarity monitoring is a service that the Cullen Lakes Association provides to its members.
Each year, from May through September, the CLA takes water clarity readings in all three lakes. Denny Opsahl takes the readings in Upper Cullen, Debi Oliverius takes the readings in Middle Cullen, and Eric and Denise Whitson take the readings in Lower Cullen.
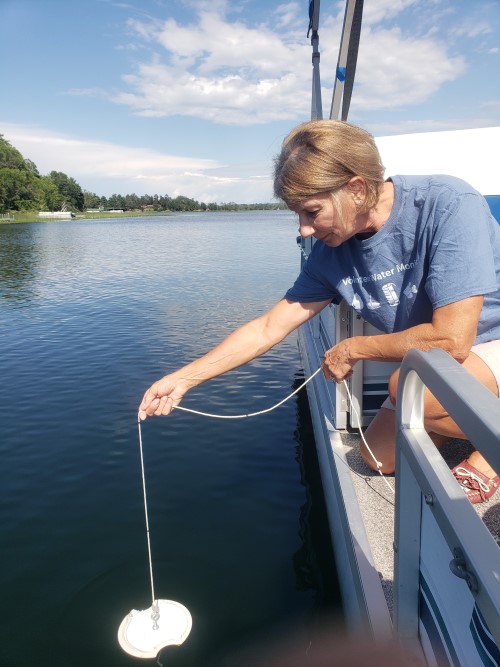
This information is valuable because it identifies whether water clarity is improving, getting worse or remaining unchanged. Water clarity is determined using a Secchi disk, a round flat disk that is painted white or sometimes black and white. The disk that is lowered into the water by a rope marked in increments of one foot. When the disk can no longer be seen, the testers measure the distance from the water’s surface to the disk to determine “feet of water clarity.”
Typically, water clarity varies month to month and to a certain degree from year to year. CLA volunteers have been taking Secchi disk readings for many years. They report their findings to the Minnesota Pollution Control Agency, which collects data from about 1,300 citizen volunteers throughout the state.
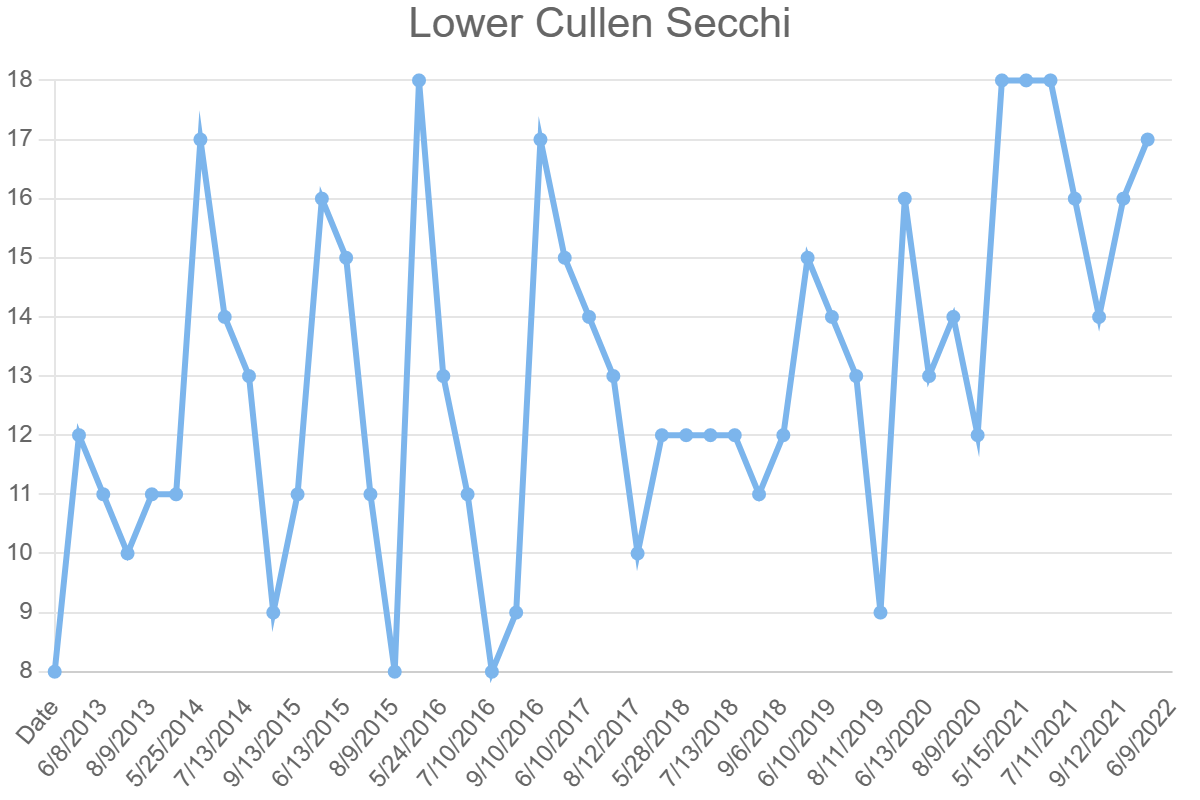
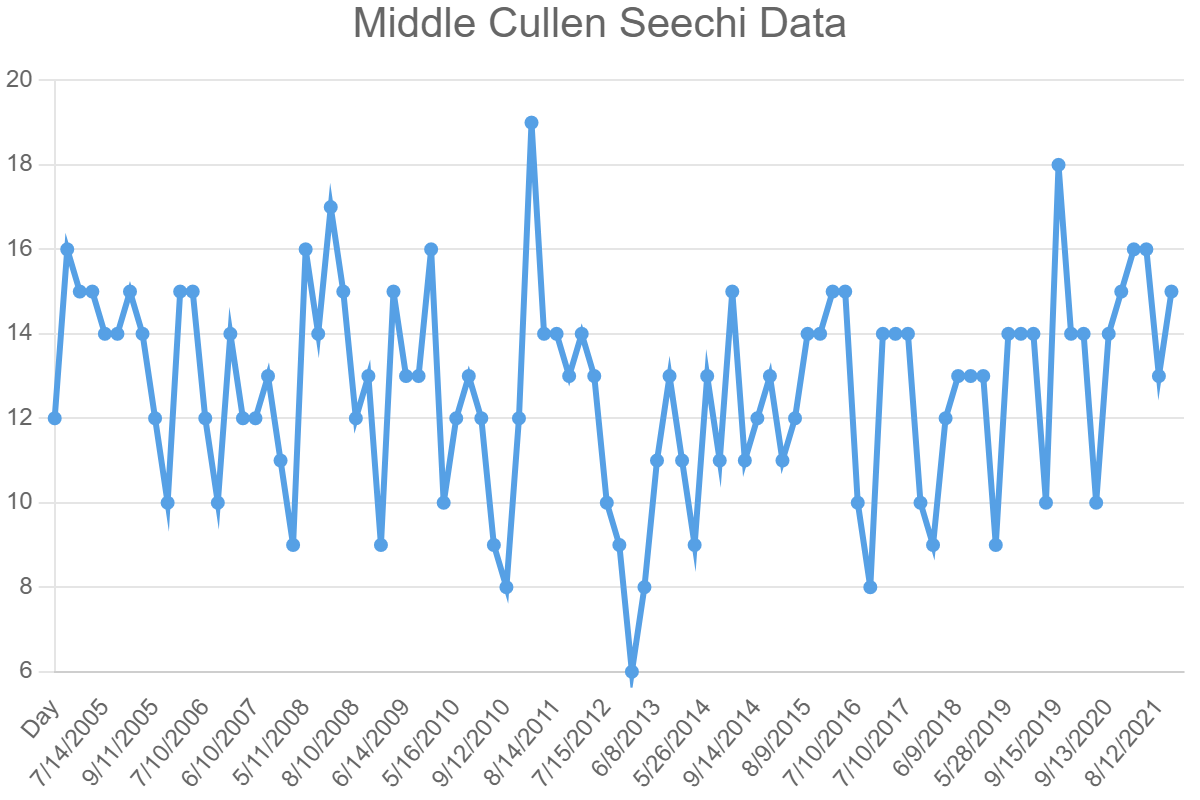
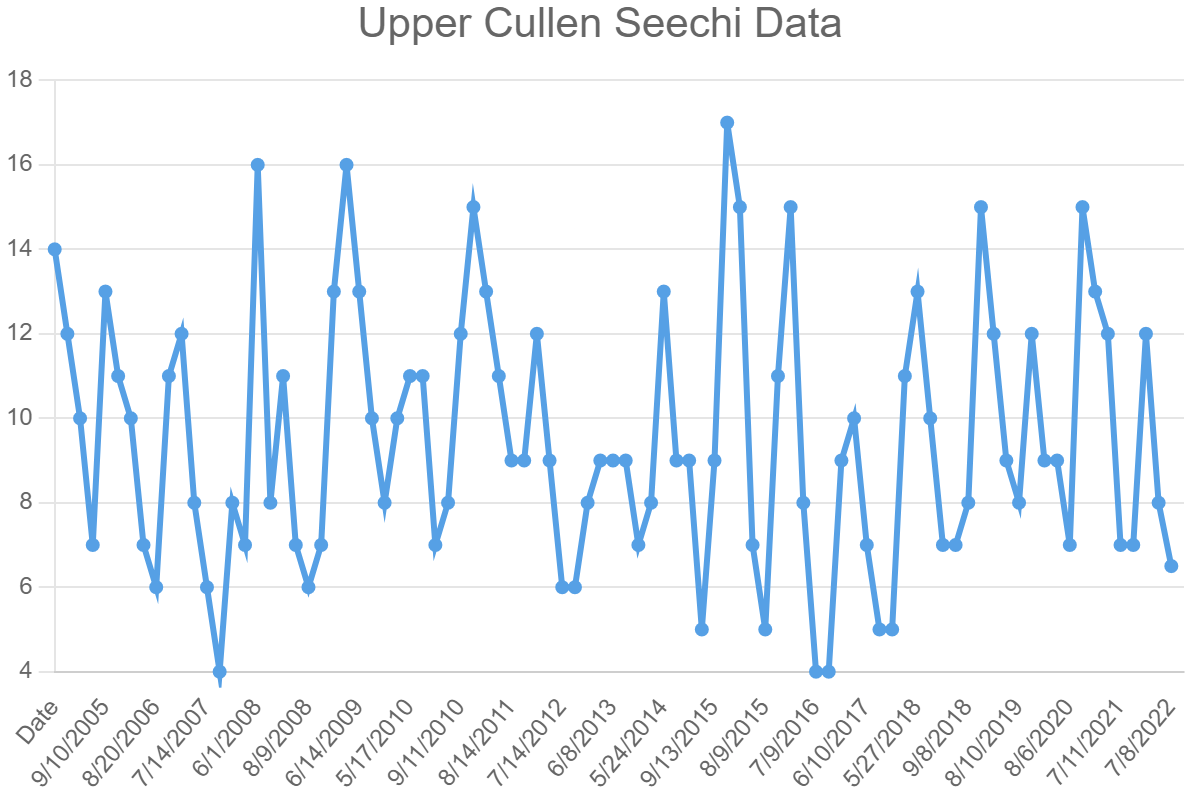
Although the water clarity in all three Cullen Lakes has varied quite a bit through those years, due to varying weather conditions and aquatic plant growth, the season average has continually fallen within the expected range for lakes in this part of Minnesota. – between 8 and 15 feet.
Good water clarity should not be taken for granted. The water clarity in southern Minnesota is commonly worse than in Crow Wing County and water clarity in far northern Minnesota is commonly better than in Crow Wing County. To maintain our water clarity, it’s important to limit unwanted nutrients from entering the Cullens. Frankly, the chemicals that make lawns green make lakes green, too. Septic systems that aren’t working properly are another source of unwanted nutrients. So, learn what you can do to help keep our lakes healthy and put that knowledge to work.
Hover over the charts below to see date information on the readings in graphs below


